Fraction Chart
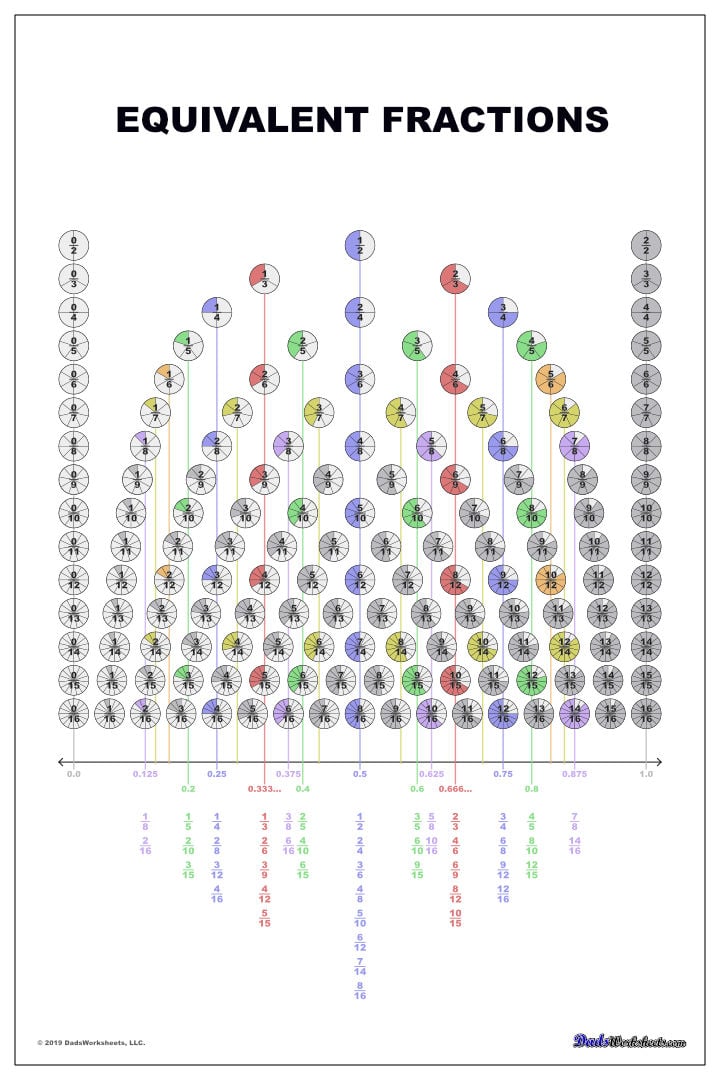
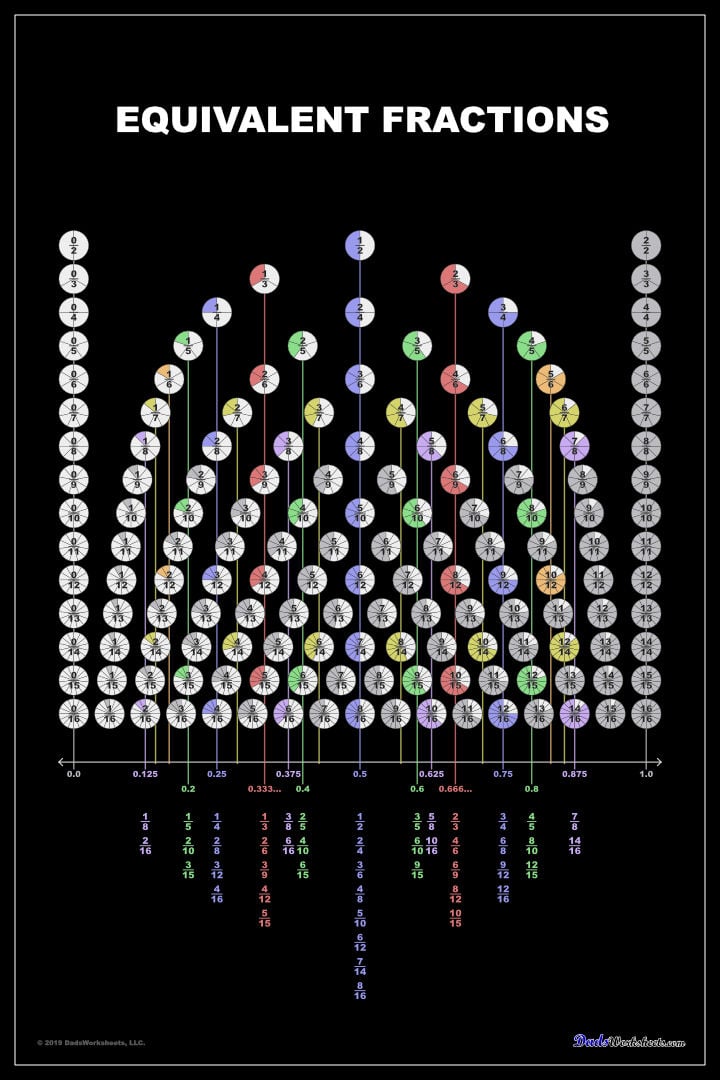
This unique rendering of equivalent fractions combines the value of the fractions positionally on the number line to create an elegant symmetry. It not only highlights fractions in their lowest, most reduced form but provides a convenient decimal equivalent for the most commonly used fractions. This really is one of the nicest reference charts I've created in the 10 years I've been building math resources!
Fraction Chart Classroom Posters!
These images are too amazing not to be appreciated at a grand scale, so I've created both the white and black versions of the fraction chart images in 24x36 inch poster sizes at super-high resolution. Click the buttons below to order one of these from direct from Zazzle.com on premium poster paper!
Using a Fraction Chart to Learn Fraction Quantities
Fractions can be tricky subject to master, but in my opinion, it's often approached in the wrong way.
It's fairly easy for 4th and 5th grade students to grasp the concept of a fractional quantity as some amount less than a whole, and the ever-present pie chart examples are one way to visualize this idea of similar sized pieces adding up to be a complete unit. Heck, I even have a pretty thorough collection of fraction worksheets that make hearty use of this tired presentation.
However, if you think about how we learn our regular math facts, it falls back on a basic skill.
I'm talking about memorization.
We don't seem to explicitly make use of this concept with fractions, even though most of the fraction problems students encounter are drawn from a range of small denominators, or denominators that share a small enough set of factors that they are easily grouped together.
We learn our multiplication facts in part using charts and tables, falling back on skills like skip counting where necessary, but ultimately our expectation is that students will memorize their math facts so that they can work more complication problems efficiently.
Fractions are no different, and my hope is that this fraction chart could be one tool to help students develop a similar familiarity with equivalent fractions and fraction to decimal conversions.
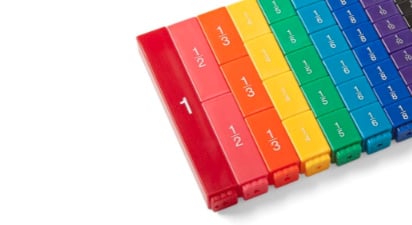
The fractions are shown on this chart grouped by their denominator and spaced according their decimal equivalent on the number line. With this arrangement, equivalent fractions wind up aligned, and in the color versions of the fraction chart they appear in a common shade as well.
While a student still needs to understand the rules for creating equivalent fractions with larger denominators, or reducing fractions to lowest form, memorizing this chart and where equivalent fractions wind up together is no different than memorizing the multiplication facts and can reinforce the idea that a fractional quantity have multiple equivalent representations with different numerators and denominators.
Comparing Fractions with the Chart
Because the fractions are aligned with the number line, you can use the fraction chart to locate the position of two fractions to determine if they are greater than, less than or equal to each other. This visual representation of the quantity expressed by a specific fraction provides another way to understand 'how much' a specific fraction represents for students who are struggling with the traditional pie chart illustrations.
Inspiration for this Equivalent Fractions Chart
When I went looking for ideas to build these fraction charts, I couldn't find anything more inspiring than the equivalent fractions table by the late Alexander Bogomolny.

Copyright 2008-2026 DadsWorksheets, LLC
As an Amazon Associate, I earn from qualifying purchases.


- Copy paper
- #2 pencils
- Big pink erasers