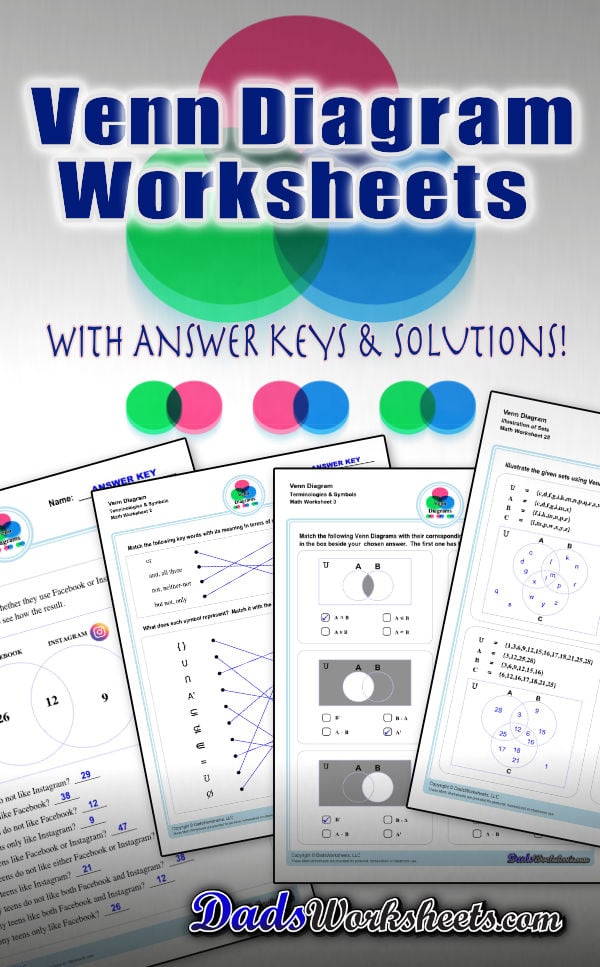
Venn Diagram Worksheets and Templates
Check out this page for Venn diagram worksheets, blank Venn diagram templates and practice for Venn diagram concepts. Venn diagrams are useful for learning set concepts such as intersection, exclusion and complements.
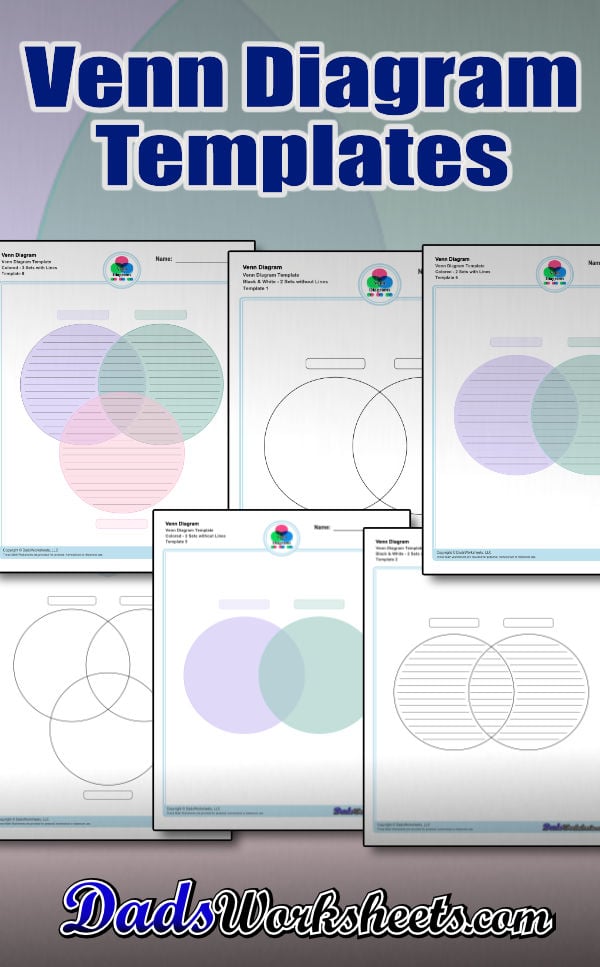
Blank Venn Diagram Templates
Venn Diagram Vocabulary Terms and Symbols
Venn Diagram Worksheets with Sets
Venn Diagram Shaded Worksheets
Venn Diagram Set Notation Worksheets
Venn Diagram Shaded the Regions Worksheets
Venn Diagram Word Problems
Working with Venn Diagrams
The Venn Diagram worksheets on this page start with getting students to familiarize themselves with terminologies and symbols that are essential when using Venn Diagrams.
The other set of worksheets require students to shade and name regions, solve set notation problems using set theory and illustrate sets through a Venn diagram - both using two and three sets. The last set of worksheets are fun word problems that will test the depth of understanding and knowledge of the students about Venn diagrams. All with answer keys and solutions!
Go ahead and print a Venn diagram worksheet from this page and check out our free printable blank Venn diagram templates too or what some may refer to as Venn diagram graphic organizer. A free Venn diagram template is available for you, whatever it is that you might need – a blank Venn diagram, lined Venn diagram, black and white, colored Venn diagram and more. These are perfect for practicing along with examples in solving questions or problems using Venn diagrams.
Venn Diagram as Graphic Organizer
A Venn diagram, also called a Set diagram or Logic diagram is a logical representation of relationships between different group of things. It usually uses overlapping circles or sometimes other shapes to illustrate the relationships between two or more sets of items. Each circle by itself represents a set, which may include numbers, letters, ideas, concepts, objects, items, members or similar terms.. Often, it serves to graphically organize things, highlighting how the items are similar and different, making it quite important in both quantitative and logical reasoning and therefore also sometimes called as graphic organizer.
To make it simpler, Venn diagram is a visual representations of mathematical sets—or collections of objects—that are studied using a branch of mathematical logic called set theory. Basically, Venn diagram is used to show set theories in an illustration/drawing.
Refer to the image below. This is an illustration of 2 sets - A, B in a Venn diagram.

People use this diagram or graphic organizer to describe similarities and differences between two objects, which in this case, Set A and Set B.
What about symbols and notations? We will discuss that in a few… but before we proceed with that area of our topic here, let me share some important key words that you should take note when dealing with Venn diagrams… Make sure to keep these words and their meaning in mind. Another simple tip: What I normally do when solving problems using a Venn diagram is I highlight these keywords in the given question or word problem then write the equivalent meaning so as not to mix one with the other especially “or” and “and”.
or = union
and, all three = intersection
not, neither-nor = complement
but not, only = difference
Understanding Venn Diagrams Symbols
Now that we already know the basics, let’s move on to Venn diagram symbols and what they represent. Venn diagram symbols are a collection of mathematical symbols that are used within set theory. Here are the most commonly used ones:

Let’s discuss further the symbols for union, intersection, and complement of a set. These three are the perfect foundation when you are just starting to take a grasp of Venn diagrams .
The union symbol (∪): represents the union of all sets (not to be confused with the letter “u”). Refer to the image below. This is an illustration of a two-set Venn diagram. The items that are in set A or set B are called the “union of A or B” or which we notate as “A∪B”. Take note that we used the word “or”, which means union.

The intersection symbol (∩): represents all elements shared or common within the selected sets or groupings. We notate this as “A∩B”, pronounced as: "A intersect B”. This is the intersection in the middle or the gray area where Set A and Set B overlap. In the image below, it represents shared elements within sets A and B. Take note that we used the word “and” this time which means intersection.

The complement symbol (A’): represents whatever is not represented in a particular set. In this case, everything that is “not” in set A or purple circle. This means that given a universe, everything that is in the universe, except for A, is the absolute complement of A in U. The diagram below shows the complement of A, all of the gray area except for purple.

How to Use a Venn Diagram
Let’s move on to three-set Venn diagram. Refer to the image below. This is an illustration of 3 sets - A, B, C in a Venn diagram.

We added a third set (C), making the unions and intersection a bit complicated than what we have discussed earlier but fret not! Same symbols and rules apply to three-set diagrams (same as two-set diagrams). To help you better understand the practical application of Venn diagram, let’s try this word problem…
Example: 30 kids were asked about their favorite colors. 7 kids like only purple, 8 kids like only green, while 5 kids like only pink. 4 kids like both purple and green, 2 kids like both pink and purple, 1 kid likes both green and pink, while 3 kids like all purple, pink, and green.

Set A contains all of the kids that like purple. Set B represents all of the kids who like green and set C represents all of the kids who like pink. Then the region marked as AB represents all of the kids who like both purple and green. The region marked BC represents all of the kids who like both green and pink. Similarly, the region AC represents all of the kids who like both purple and pink. The region in the middle ABC represents all of the kids who like all purple, green, and pink.
Take note of the word “only” in the word problem. This is different from “Set A”. Set A includes all of the kids who like purple (all those marked with A, AB,AC, ABC). Meanwhile, all of the kids who like only purple is the region marked as “A” only. Same thing applies to Set B and C.
Okay! Let’s figure this out together. Draw or print a blank Venn diagram then try to illustrate as per the information given in the word problem. Let’s compare our answers after.
Here’s what I came out with my Venn diagram. I’ve written down my solutions below as well.

And here’s the summary based on what I have on my Venn diagram…
16 answered purple from regions A+AB+AC+ABC (7+4+2+3). I computed the sum from all of the regions where purple is indicated. This is Set A.
16 answered green from regions B+AB+BC+ABC (8+4+1+3). I computed the sum from all of the regions where green is indicated. This is Set B.
11 answered pink from regions C+AC+BC+ABC (5+2+1+3). I computed the sum from all of the regions where pink is indicated. This is Set C.
22 answered purple or pink. from regions A+C+AB+AC+BC+ABC (7+5+4+2+1+3). I computed the sum from all of the regions where purple or pink is indicated.
25 answered purple or green from regions A+B+AB+AC+BC+ABC (7+8+4+2+1+3). I computed the sum from all of the regions where purple or green is indicated.
23 answered green or pink from regions A+C+AB+AC+BC+ABC (8+5+4+2+1+3). I computed the sum from all of the regions where green or pink is indicated.
All of the kids answered at least one color because the total number of all of the numbers in the circles of the Venn diagram is 30, which is the total number of all of the kids asked about their favorite colors as per the given problem.
Things to Remember About Venn Diagrams:
- Venn diagrams are also called set diagrams or logic diagrams.
- A Venn diagram in math is used in logic theory and set theory to show various sets or data and their relationship with each other.
- A set is a group or collection of things, that typically have something in common.
- An element or member of a set is any one of the distinct objects that belong to a set.
- A set of all possible elements is called the Universal set.
- Venn Diagrams were invented by John Venn, an English logician, in the 1880s.
- While there are many ways to organize a Venn diagram, they most often consist of overlapping circles.
- When circles overlap or intersect, those sub-sets that are shared are known as union or intersection.
- The middle of a Venn diagram where two or more sets overlap is known as the intersection.
- The categories not represented in a set are known as the complement of a set.
- Tip: Always start filling values in the Venn diagram from the innermost value.
- Note: The curly braces “” are the customary notation for sets. Do not use parentheses or square brackets.
- While often illustrated as a pair or triplet of circles, Venn diagram can use any number of circles or any other shape to show the differences and intersections of different sets.

Copyright 2008-2026 DadsWorksheets, LLC
As an Amazon Associate, I earn from qualifying purchases.


- Copy paper
- #2 pencils
- Big pink erasers