Core Math Worksheets
Fraction Worksheets
Algebra
Other Worksheets
Place Value
Percentages
Rounding Numbers
Ordering Numbers
Standard, Expanded, Word Form
Mean Median Mode Range
Ratio Worksheets
Probability Worksheets
Roman Numerals
Factorization, GCD, LCM
Prime and Composite Numbers
Pre-Algebra
Geometry Worksheets
Blank Clocks
Telling Analog Time
Analog Elapsed Time
Greater Than and Less Than
Money
Arithmetic Sequences
Geometric Sequences
Venn Diagram
Graph Worksheets
Measurement & Conversions
Patterns and Puzzles
Color by Number
Holiday & Seasonal
Early Learning
Printables
Calculators
Math Worksheets by Grade
Worksheet News
Solving Systems of Equations by Graphing Worksheets
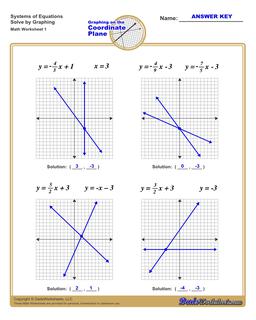
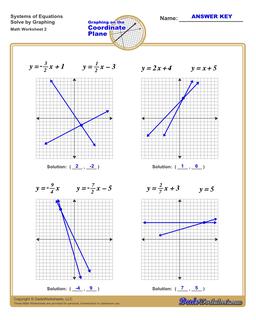
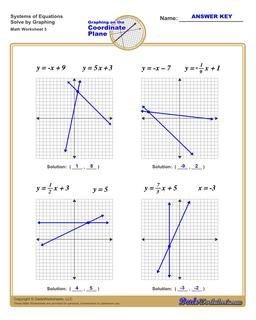
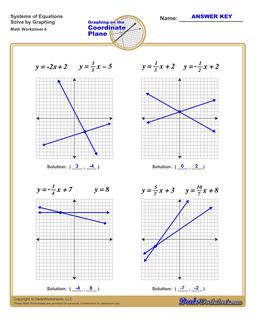
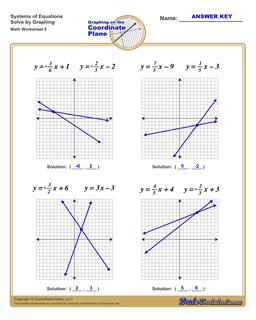
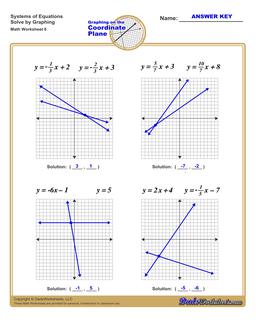
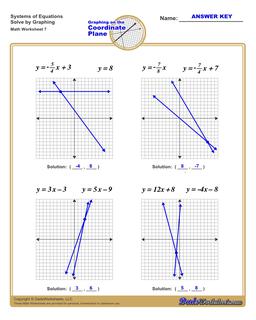
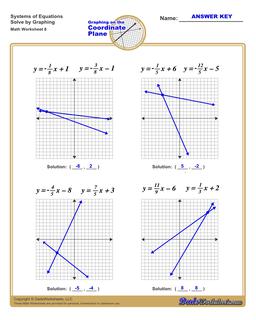
The worksheets on this page have four coordinate planes and systems equations in slope intercept form that students graph to solve, and includes an answer key showing the correct graph.
Graphing Systems of Equations
What are Systems of Equations?
Two or more linear equations that are related are called a system of equations. Graphing systems of equations involves graphing each individual linear equation in the system. The places where the lines intersect represent solutions where two or more of the linear equations share a common solution, and that point is regarded as the solution to the entire system.
You can solve a system of equations by graphing the lines and seeing where they intersect. This is called "solving by graphing" and is a valid approach for linear equations with relatively simple slope and y-intercept values. The graphing systems of equations worksheets on this page fit this criteria and they are good practice for building a visual intuition of the solution process.
In practice, it the linear equations in a system are more complicated and attempting to determine an accurate solution by graphing is limited by how easily readable on each axis. Generally, these solutions should be regarded as approximate except in cases where the slopes and intercepts in the equations are small integers and the solution is obviously correct for both equations. Even then, manually checking the solution algebraically is still a sound verification.
In practice, it is more common to solve systems of equations by substituion. Typically your system of equations will include two equations in slope intercept form, with both equations as a y value calculated in terms of x. Solving by substituion involves combining the two equations into a single function that gives either a x or y coordinate. You can do this easily by replacing the y side of one of the equations with the mx+b expression from the other (so, "mx+b = mx+b") and the solving for x. This will give you an x value that can then be substituted into either of the original equations to calculate a corresponding y coordinate. The resulting x and y values make up the coordinate of a solution to both equations, and therefore a solution to the combined system of equations.
Solving Systems of Equations by Graphing
You can solve systems of equations by graphing using the following steps:
- For each, equation graph the line. Click here if you need help or practicing graphing linear equations .
- If the lines do not intersect (they are parallel), then the system of equations has no solution.
- If the lines do intersect, find the coordinates of the point where the lines from each equation intersect.
- The intersection point is a shared solution to both equations, and therefore a solution to the entire system of equations.
While this approach is arguably more intuitive compared to solving by substituion, it can also be less precise. Again, it's recommeded that students check solutions obtain from solving a system equations by graphing by plugging the x coordinate from the solution into each equation and verifying that the calculated y value from each equation in the system winds up being the same.
If you are graphing linear equations, the worksheets on this page provide great practice resources for middle school algebra students. You can also print a blank coordinate plane to graph other equations, or try working with the slope calculator to see how different points are used to calculate slope and find equations in slope intercept form.

